
Solar Electricity Supply and Demand
How much electricity is produced by solar installations? Developers claim that around 300 households can be supplied per MWp of installed solar capacity. Is this correct?
The total amount of electricity per year may be sufficient, but SolarQ discovered that mismatches of times of supply and demand mean that approximately half of all electricity from any solar installation will not be immediately used by the target household number. In the absence of sufficient on-site battery storage, excess electricity will be lost, exported (to houses elsewhere, or abroad) or stored somewhere else in the system (in batteries or in the form of hydrogen). Our analysis uses the proposed Botley West Solar Farm in Oxfordshire as a ‘worked example’ but the results can be scaled up or down to all solar installations.
How much land is taken up by ground-mounted solar?
The industry claims that only 0.1% of UK land is currently taken up by ground-mounted solar, a figure likely to rise to only 0.3% if 2050 targets for solar are met (compared with 0.6% for golf courses).
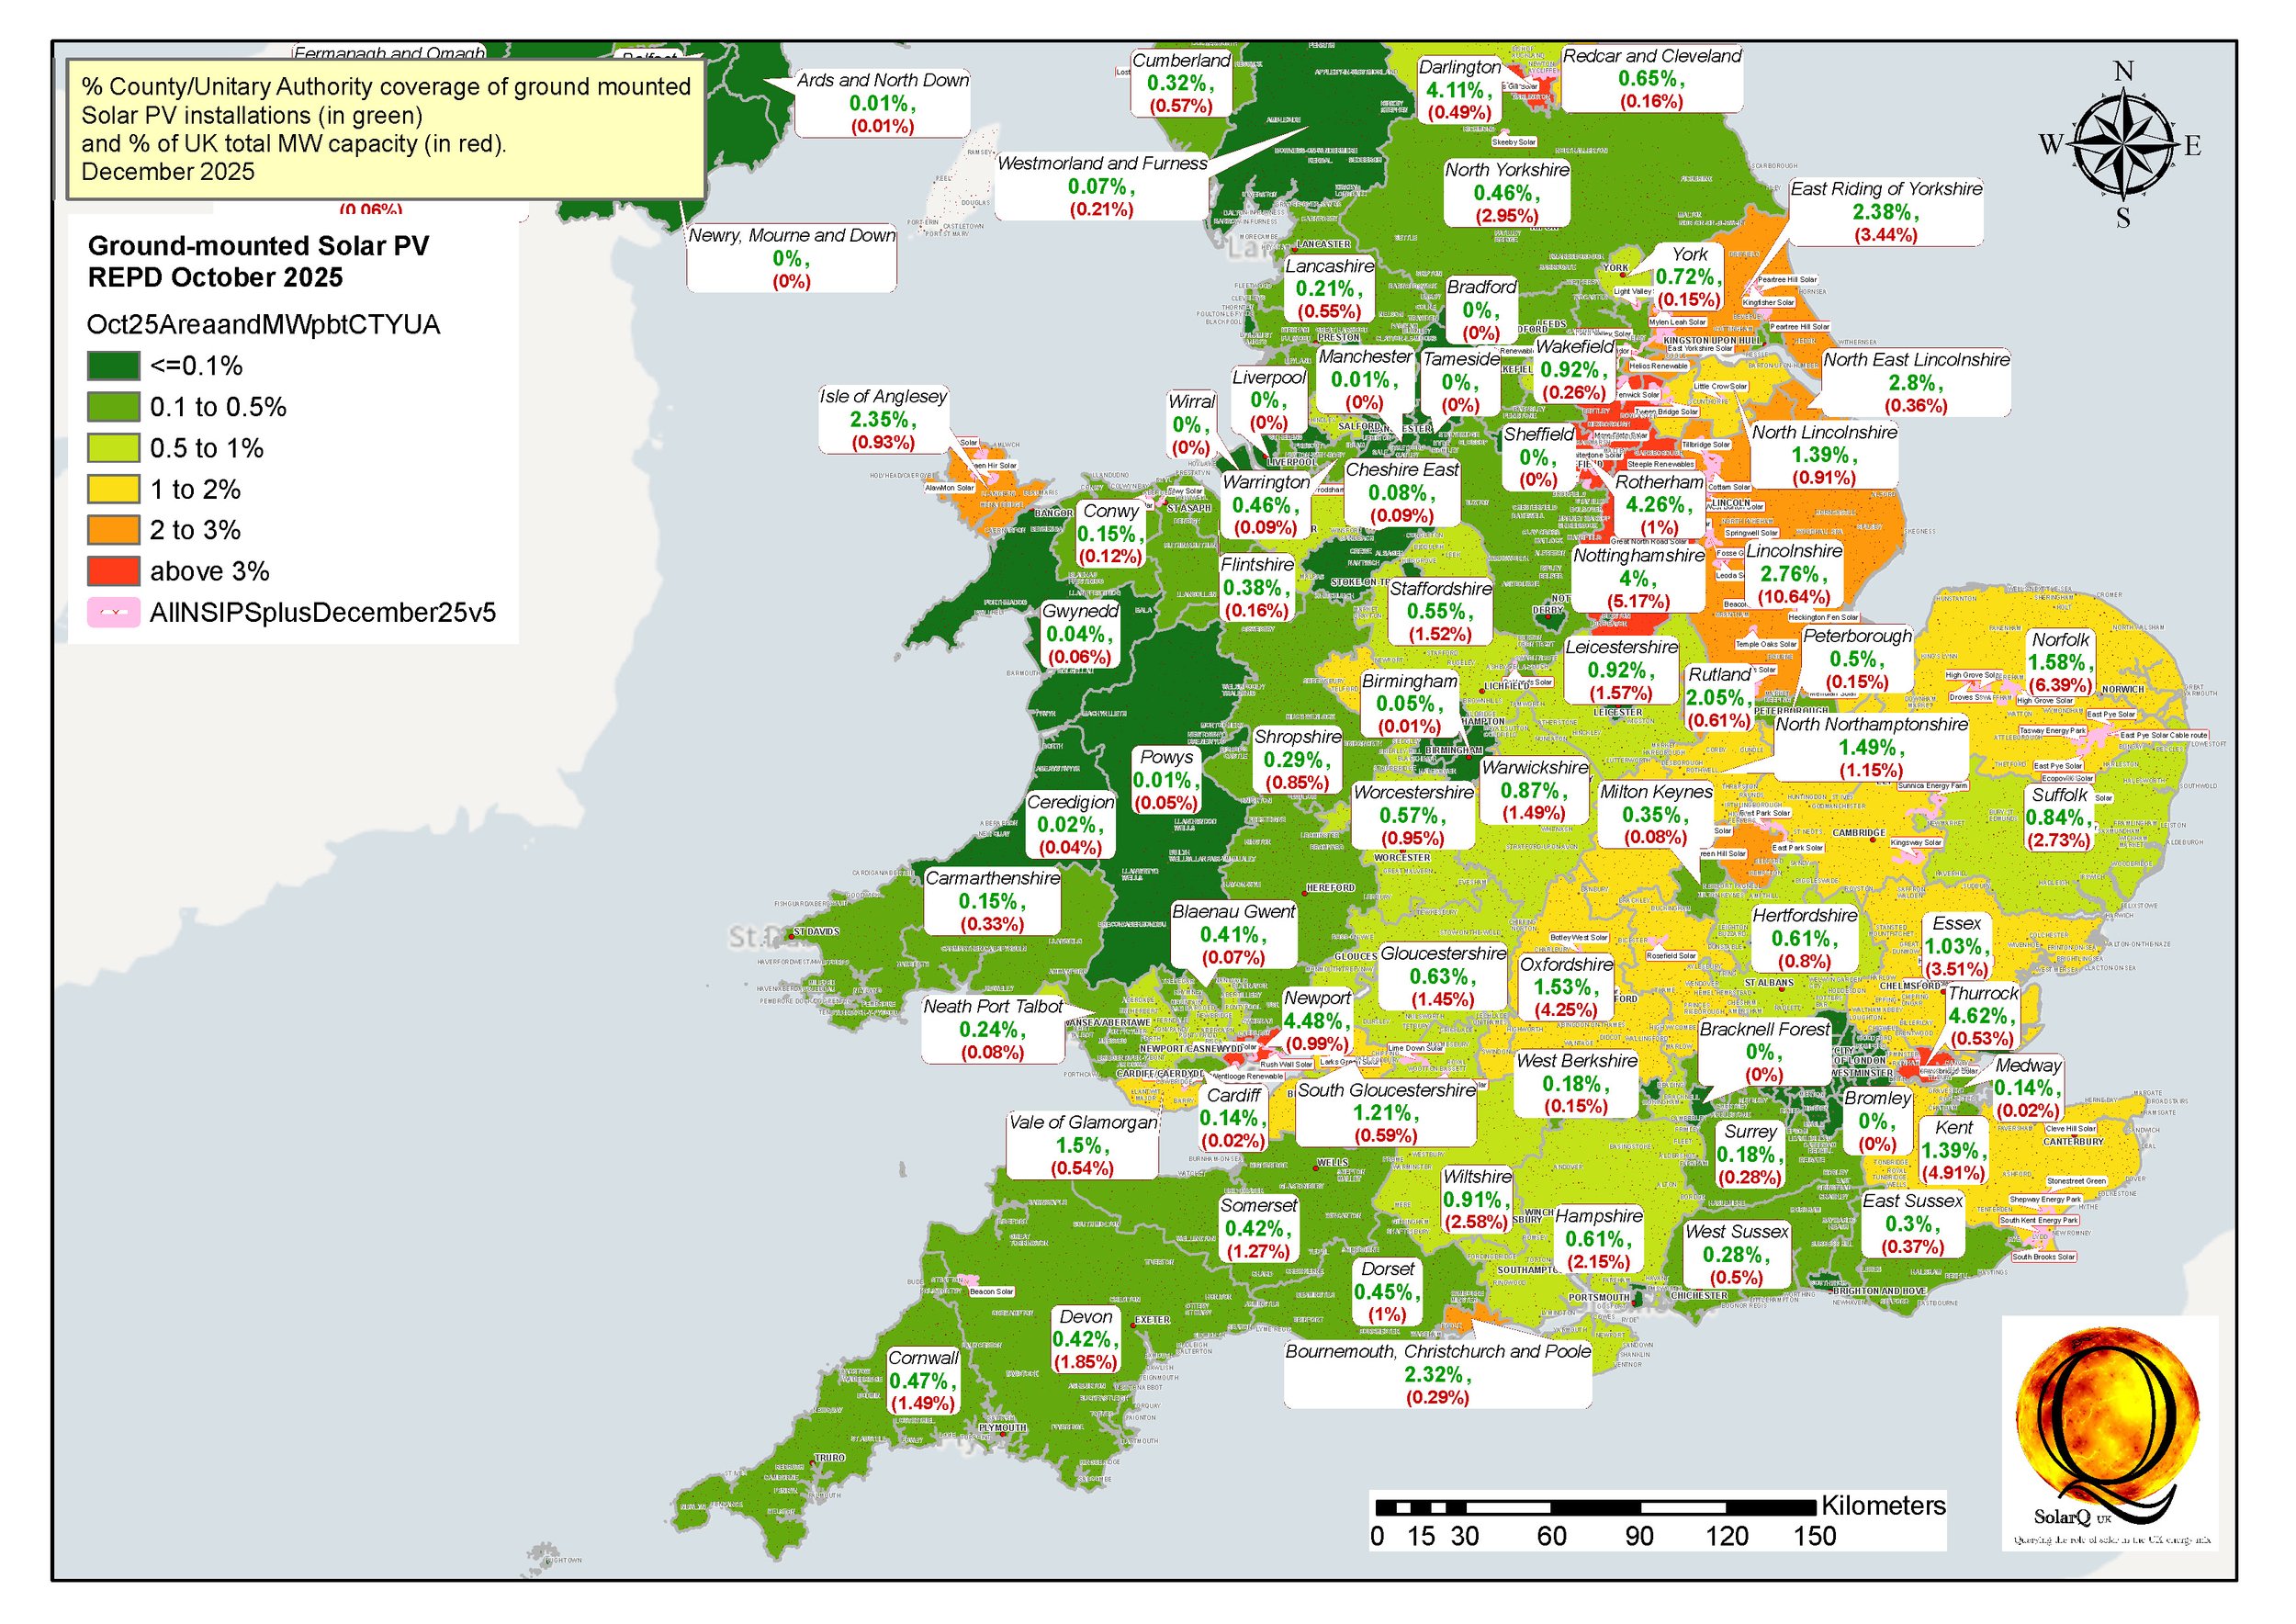
The Renewable Energy Planning Database (REPD), October 2025 edition, records the current status of all renewable installations, including ground-mounted solar of up to 50MW (at various stages of development). Information up to December 2025 on 80 NSIP-scale, ground-mounted solar proposals is available from developer and other websites (including the Planning Inspectorate). SolarQ’s analysis shows that all these installations will occupy far more land than the industry estimates, for example 4.00% of Nottinghamshire, 2.76% of Lincolnshire, 2.38% of the East Riding of Yorkshire (all with land areas greater than 1,000 sq. kms).

How much Best and Most Versatile (BMV) agricultural land is used by solar installations in England?
NPPF and other guidelines recommend that solar installations should avoid the use of Best and Most Versatile (BMV) agricultural land, which is needed for growing food. These guidelines are not being followed.
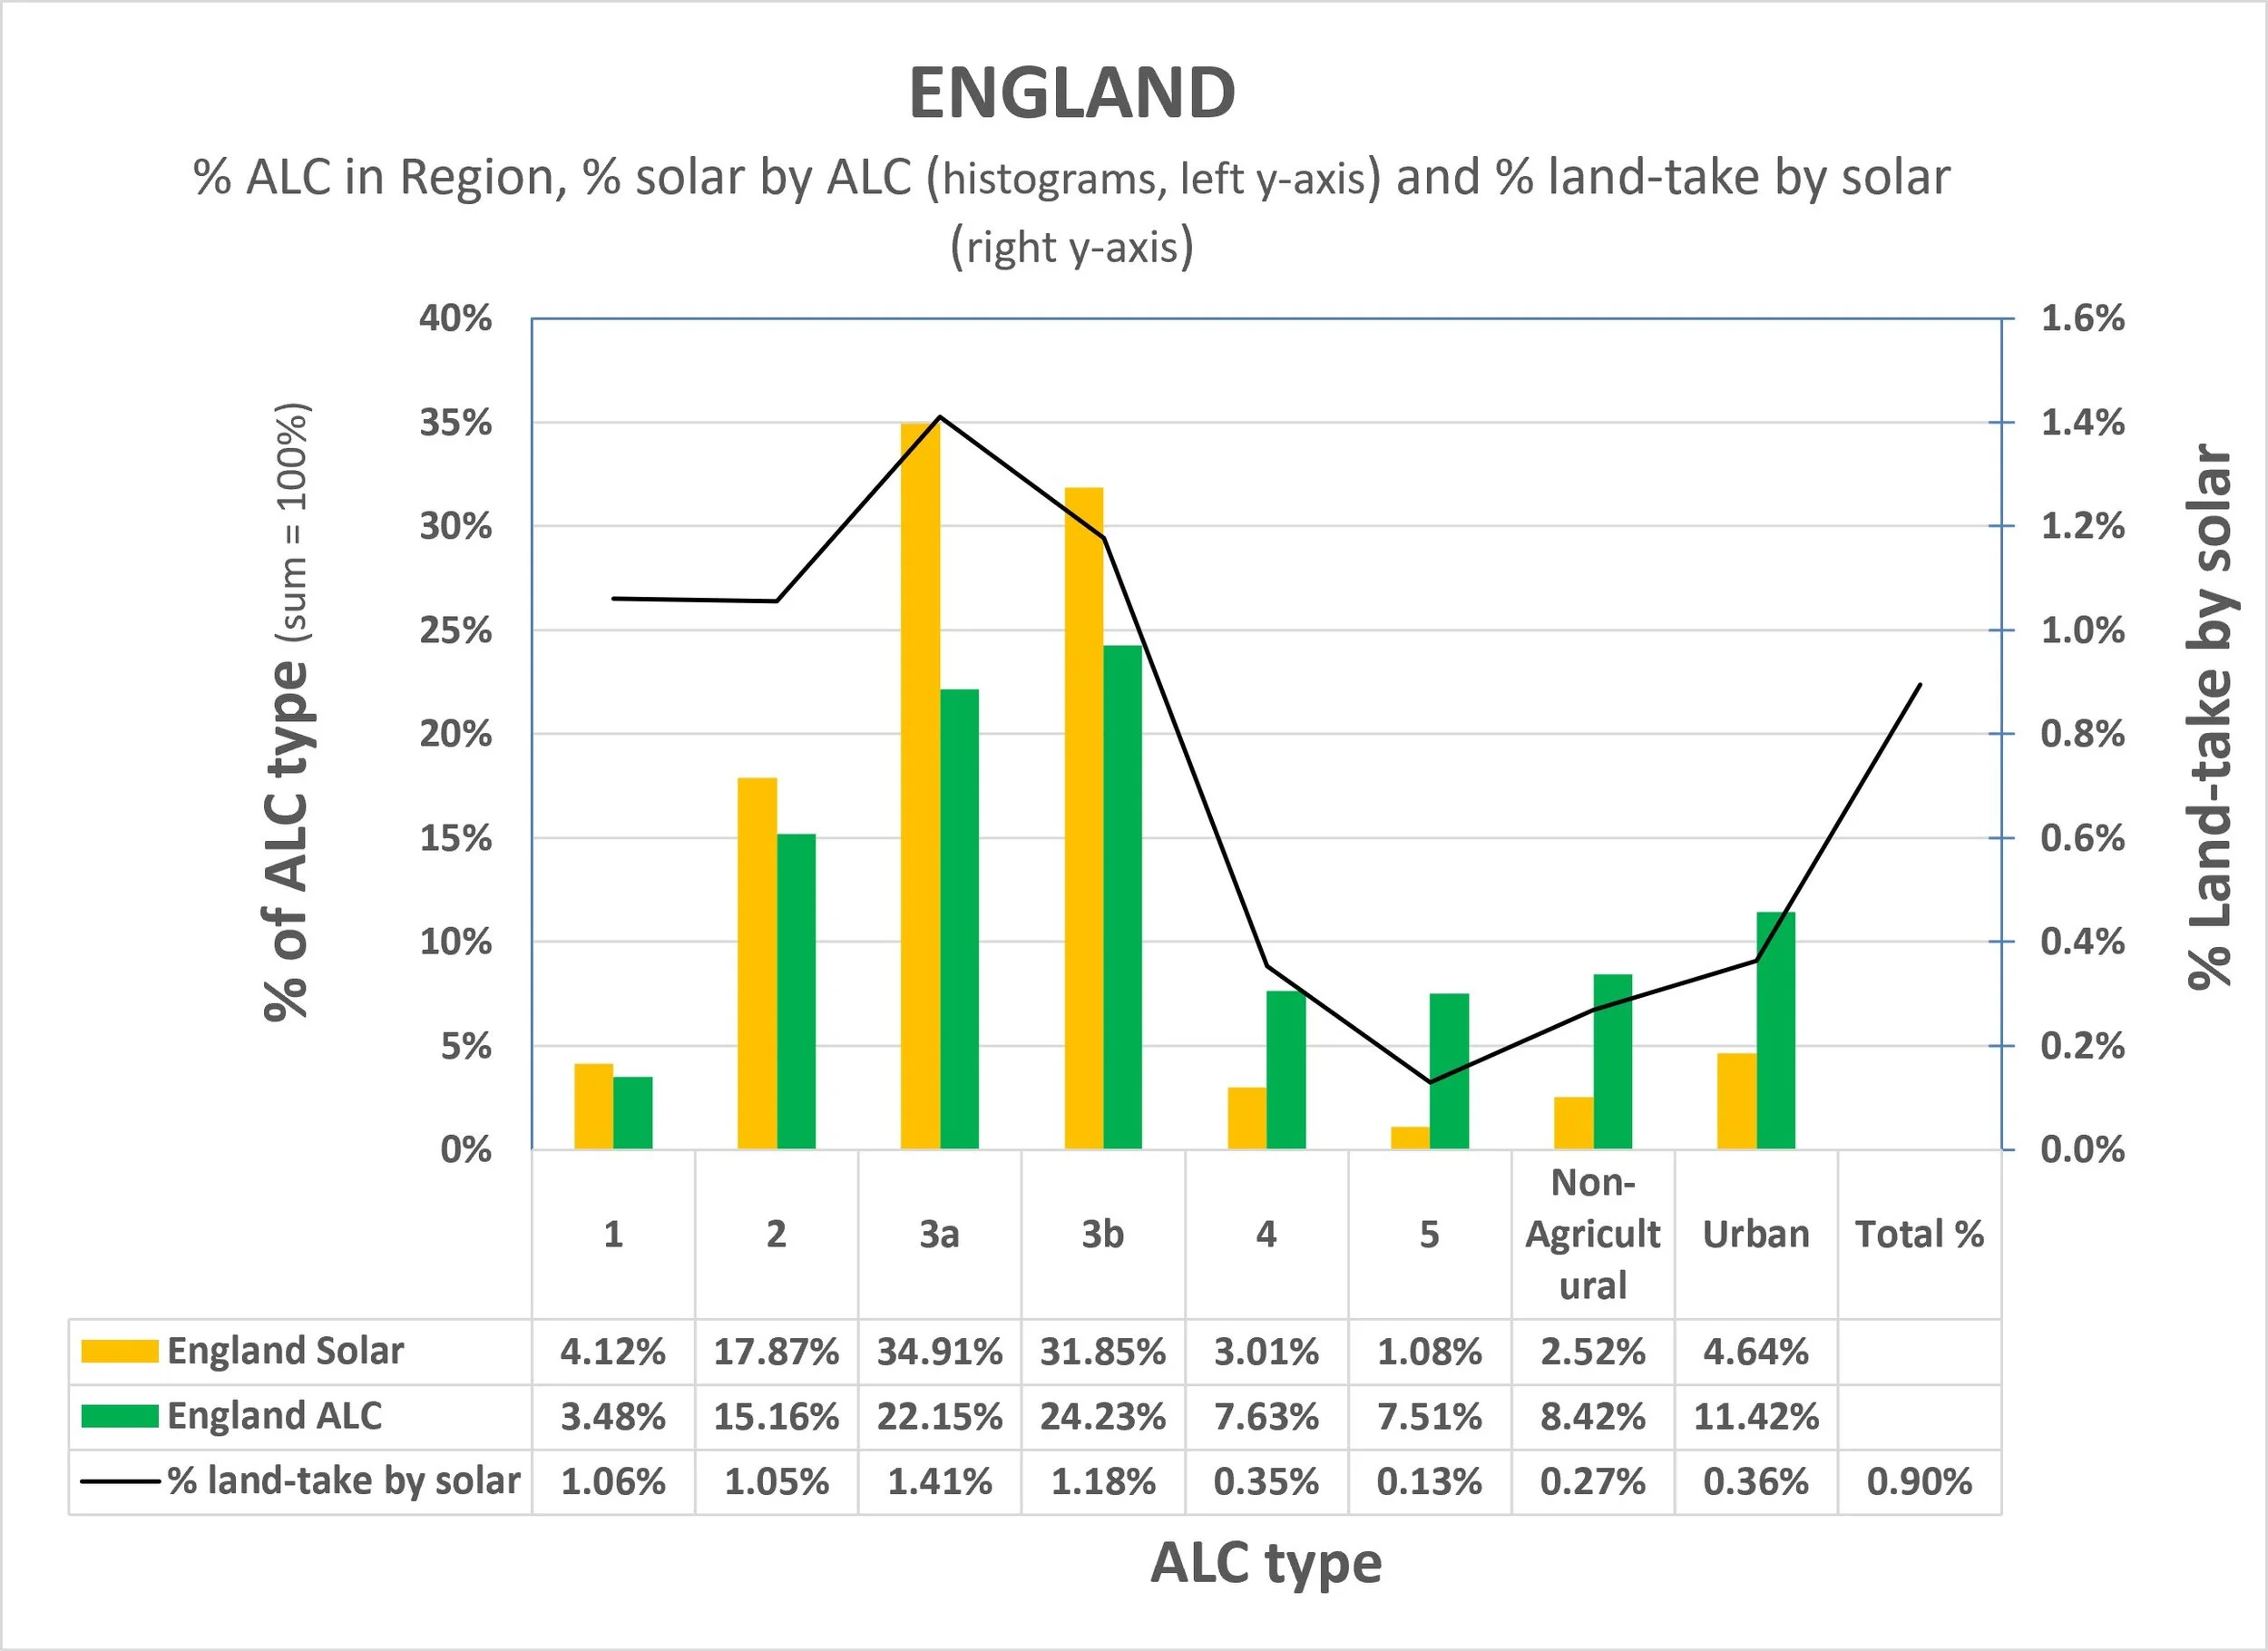
A new Predictive Agricultural Land Classification (ALC) map for England, released in April 2026, distinguishes ALC Grades 3a and 3b for the very first time and was used here to establish just how much BMV land (ALC Grades 1 to 3a inclusive) ground-mounted solar installations are taking. The green histograms in the above chart show the percentage of all land in England in the different ALC classes. The yellow histograms show the percentage of the different grades of land in solar installations. SolarQ’s analysis reveals that 51% of all farmland (ALC Grades 1 to 5 inclusive) is in the BMV category (ALC Grades 1 to 3a) and 49% in the non-BMV category (ALC Grades 3b to 5), but 61% of solar installations are on BMV land and only 39% on non-BMV land. This indicates a disproportionate use of BMV land by solar, in stark contrast to Government recommendations. The total land-take by solar in England is 0.9% but this figure varies regionally from 0.22% in the North West to 1.98% in the East Midlands. Regional variations in BMV/non-BMV land-take are also explored in the Report.
Do solar installations affect local house values?
No developer acknowledges that ground-mounted solar installations affect the value of nearby properties. There is mounting evidence that they do, but this is being ignored in submissions to the Planning Inspectorate.
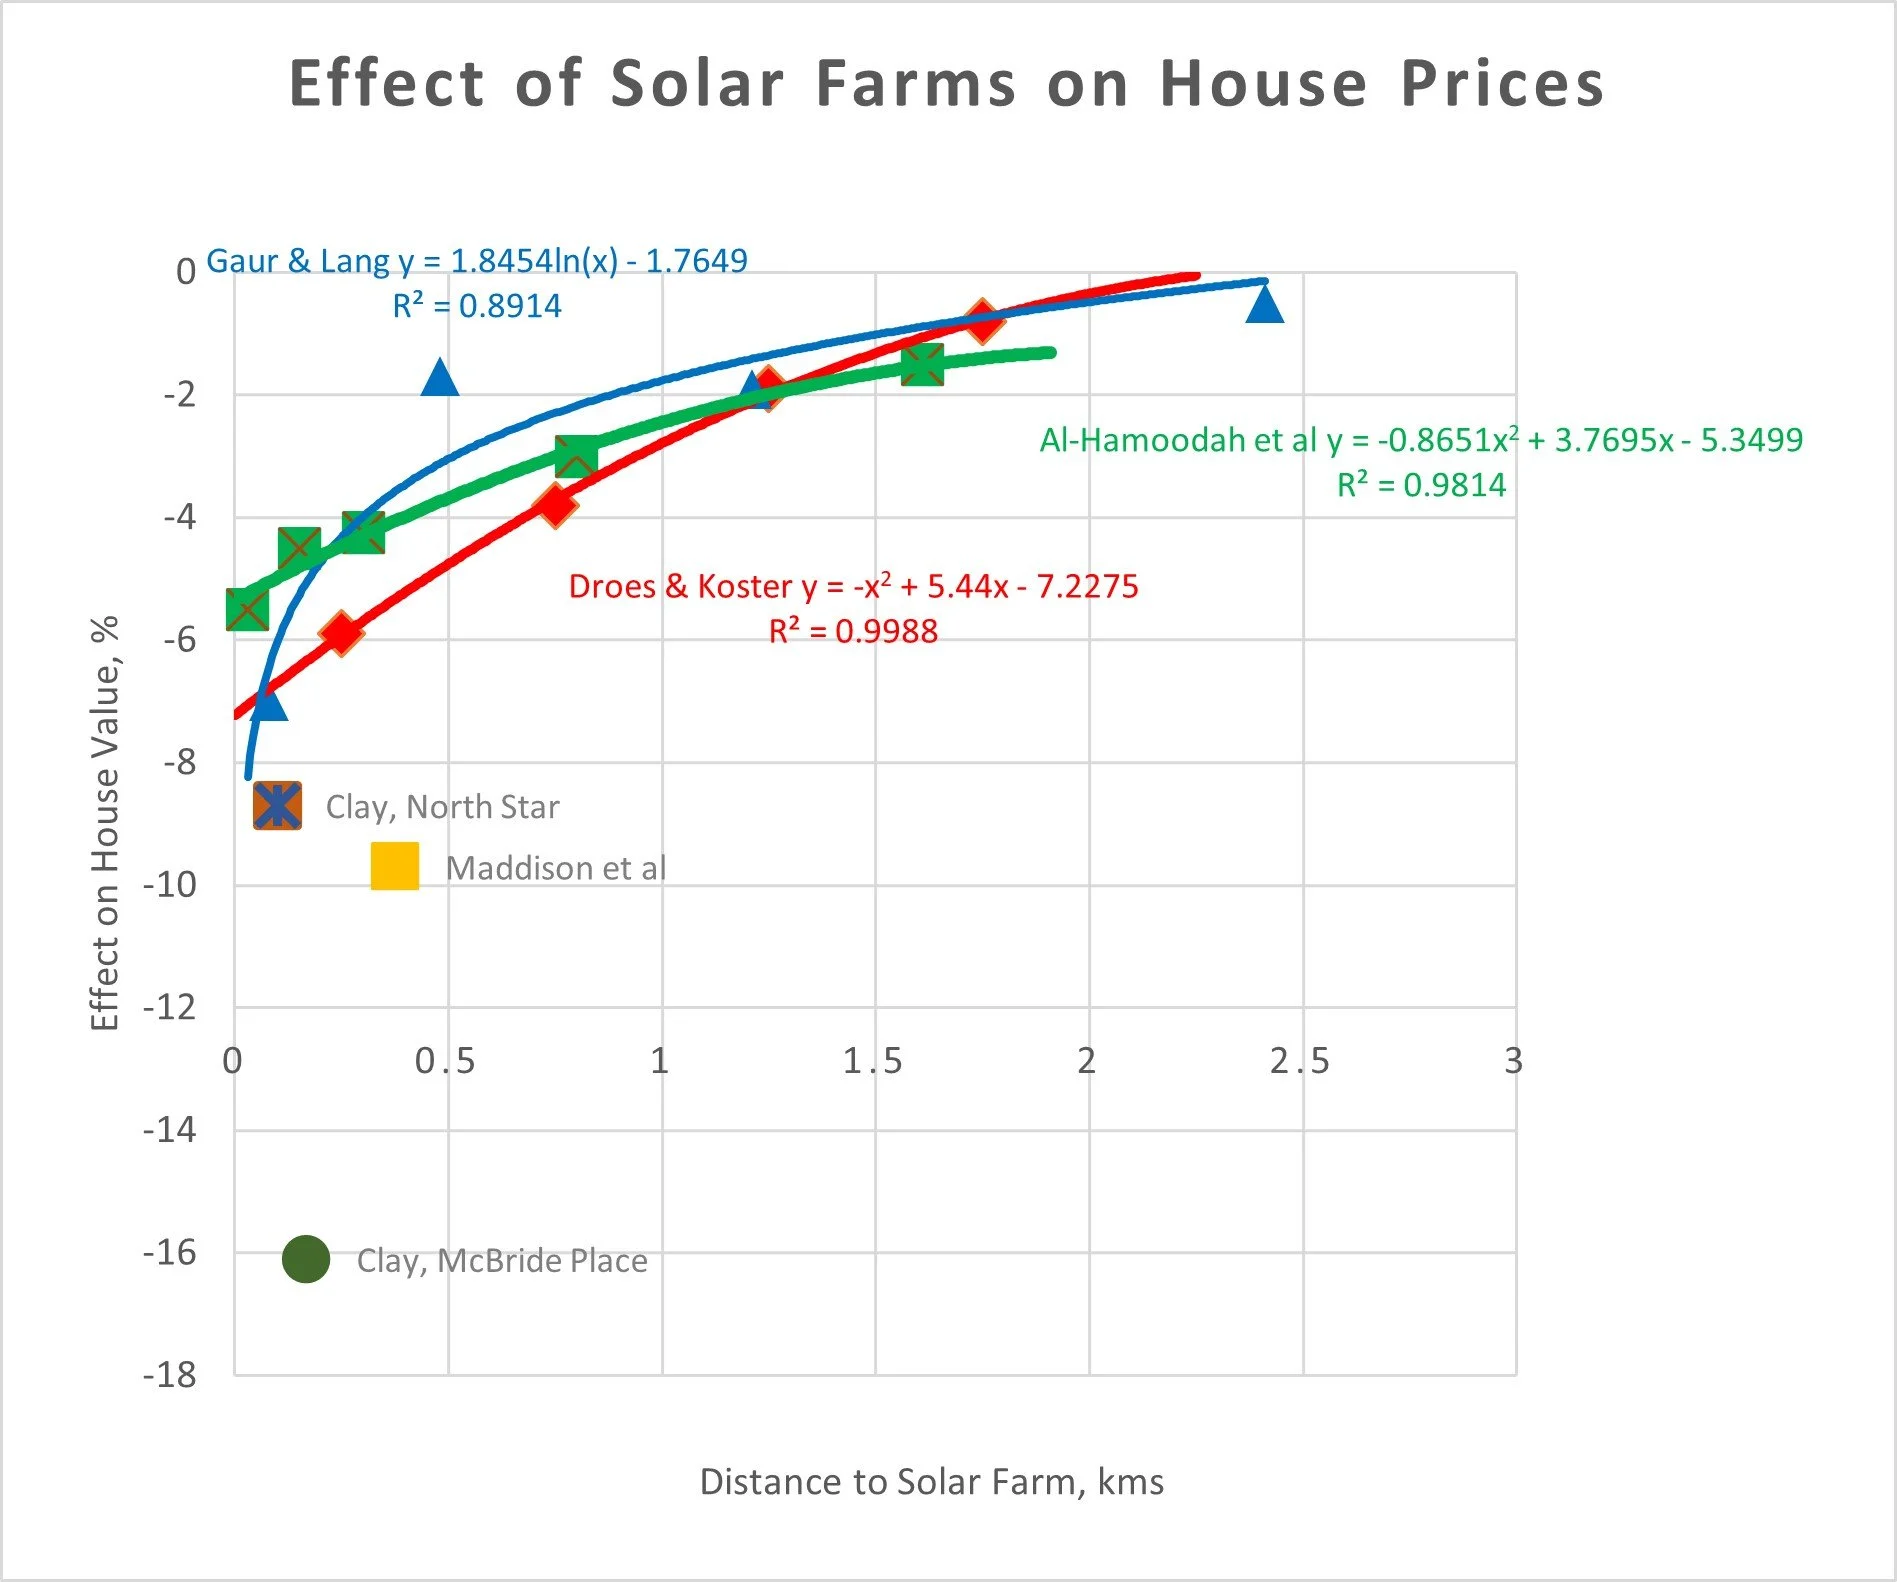
SolarQ’s survey of global literature suggests variable impacts of solar farms on house values. The majority of early studies were by American realtors (estate agents), were not peer reviewed and contain flawed analyses. More recent, peer reviewed studies in both America and Europe analyse data from many thousands of house sales at different distances from solar installations. The graph shows the results of such studies (different colours for different studies) and relates the impact of solar farms on house values (vertical axis; negative values mean a reduction in value) to the distance from the edge of the solar farm (horizontal axis, in kms). The closer to the solar farm, the larger the impact. Most studies conclude this effect is larger in rural areas and increases with the size of the solar installation.